|
Hello, I want to use the survey for checking the accuracy of the Global Forest Change data for a province in Spain. How can I generate a set of plots (the csv file) that I can use the survey with?? I would like to start with one province (Gerona) and then maybe assess other provinces. There is a good shapefile with the provinces (Provincias) of Spain provided by the Spanish ministry of agriculture here : link Thank you for the help!! |
|
Generating the files that contain the plot locations can done though Quantum GIS or through the Google Earth Engine Playground. In this answer I will focus on how to generate the files through the Google Earth Engine Playground as it is very easy to add the Global Forest Change data to the plot information in this way: Steps
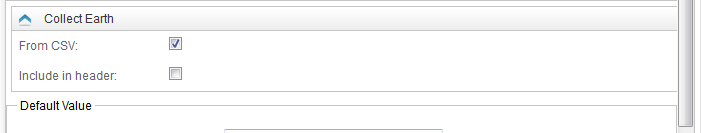
RequisitesTo follow this way of producing the plot locations you will need to be a Google Earth Engine Trusted tester. If you don't have access yet please go to this website (link) and fill the form. It usually takes one or two days to get access. How to upload a shapefile to a Fusion tableSo to do this you will need to upload the shapefile to your Google Drive using the service provided by ShpEscape.com ( choose the option that says shp2FusionTables ). Upload your file and wait until the process is finished. Once it finishes you will get results page with a link to the fusion table that has been generated inside you Google Drive ( in my case I have uploaded the provincias.shp file that you mention and I got this result : link How to generate the plot filesNow that we have the shapefile for the provinces of Spain as a Fusion table we can use it to generate the plots within those boundaries. Now there are two options, to generate a random or a systematic grid of plots. To generate a systematic grid use this link: GEE App for Systematic and Random sample generation over countries/provinces/districts or shapefiles of your own. How to incorporate extra data ( "From CSV" attributes)Collect Earth projects can contain many attributes that are marked as "From CSV". This means that the values of these attributes are not coming from the assessment of the user, instead these values are extracted from other sources. Usually most Collect Earth surveys incorporate attributes of elevation, slope and aspect which are derived from the Digital Elevation Model provided by the USGS SRTM dataset and that are obtained using the Google Earth Engine scripts previously mentioned. One can incorporate many other attributes to a survey that are obtained from other data sources, such as precipitation, population, administrative unit data (region, province and so on), soil and climate data and many other. This is really convenient as the data will be available for analysis together with the data that is actually assessed through visual interpretation, really augmenting the analysis capabilities though Saiku. You must define the attributes that you want to add to the survey in this way (by marking them as coming "From CSV" in the Survey Designer :
For instance in the survey that we are preparing to assess the accuracy of the Global Forest Change data ( the one collector is speaking about : here it is ) we adding in this way the attributes called ELEVATION, SLOPE, ASPECT, ADM1_NAME, COUNTRY, GFC_TREE_COVER, GFC_FOREST_GAIN, GFC_FOREST_LOSS, GFC_FOREST_LOSS_YEAR and GFC_DATA_MASK ). So IT IS IMPORTANT that the file that you generate with the plot locations has exactly those column in THE SAME ORDER! How do I know what the order of the expected coulmns in the CSV are?? Easy, find CEP file that you are using (the one that you just downloaded or if you are creating your own survey the CEP file that you have exported from the Survey Designer ). Instead of opening it by double-clicking the file right click on it and choose to open it with WinZIP/WinRAR/7Zip, whatever compression software you have. Inside the CEP file(which is actually a zip file) you can find a file called test_plots.csv , this is a CSV containing dummy plot locations generated automatically by Collect. This file contains the exact order that Collect Earth expects for the loaded CEP file. In the case of the GFC accuracy assessment this is the format : So, of course the last step in to go to Collect Earth and open the properties menu (Tools->Properties). Once you do that choose the sample data (the CSV that you just generated) by browsing to the file and loading it! If everything went well you will see the plots in Google Earth.... Hope that this answer was of some help, I know it has taken a while to answer sorry about that! |
|
Hello, We are in the process of building an interactive application for accuracy assessment sampling design. The output will be a stratified random sample of the map classes in the Collect Earth plot file format. Before using this application you will need to download the Global Forest Change data and clip it to your study region. We will post the application on this page very soon. |