Analyzing data with Saiku
Saiku Server is a web-based open source software that facilitates data visualization and data querying. Although a version of the software is freely available on the Saiku website, a special version has been customized for greater compatibility with Collect Earth. Saiku Server is included in the Collect Earth installer.
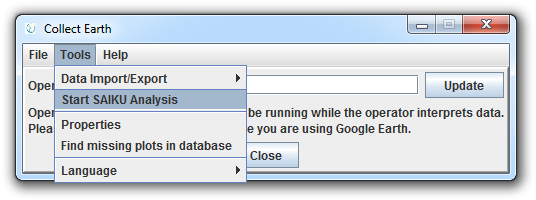
In the main Collect Earth window, select Start SAIKU Analysis under the Tools menu.
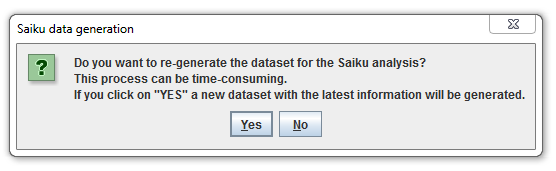
The first time you run Saiku, click YES to generate the dataset. In the future, click No to simply re-use the dataset that you have already generated.
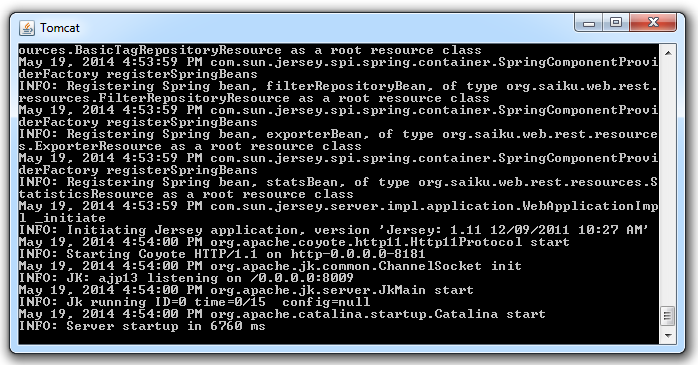
A Tomcat server window will open (with the Java logo). Leave this window open while working with Saiku, but feel free to minimize it.
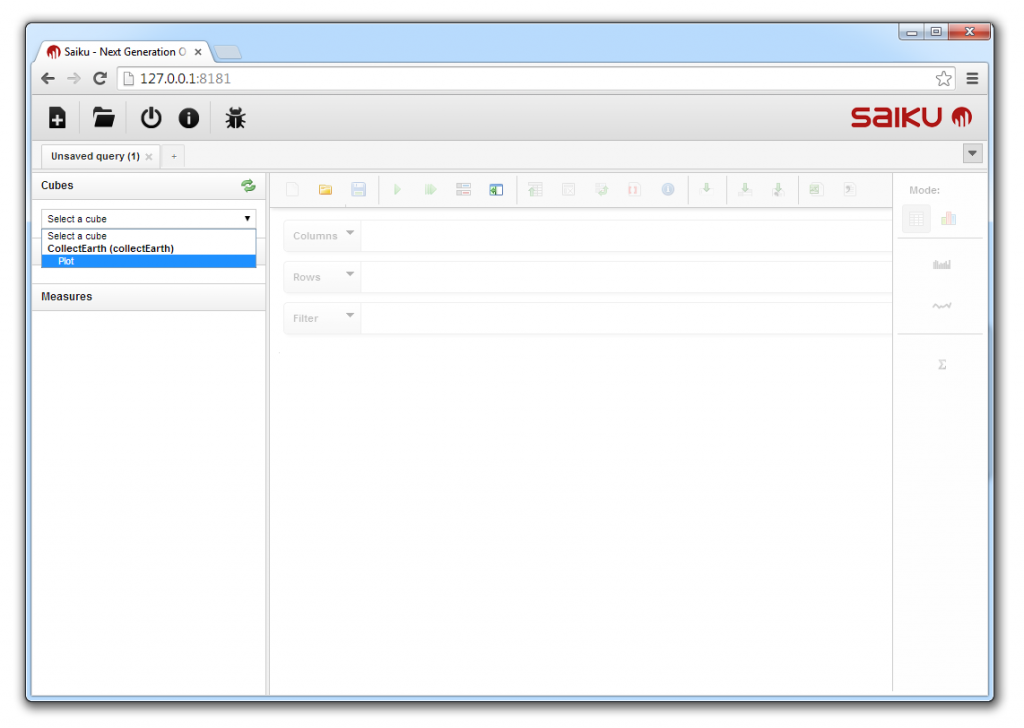
Saiku will open in the web browser you have selected (Chrome or Firefox) in your Collect Earth properties. To begin querying and visualizing Collect Data, click the dropdown arrow under Cubes in the left-hand panel and select Plot.
The full set of Collect Earth data fields will appear in the left panel and the Saiku toolbar will be colored in and ready to use. Collect Earth data cubes are contained within folders.
The folders listed under Measures contain Collect Earth metadata, which the user has not entered (with the exception of Year of change data).
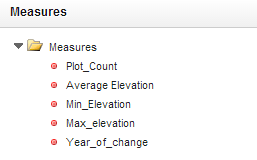
The average, minimum and maximum elevation data are assigned to each plot after the grid is established, and before the user enters land use data in Collect Earth. The elevation data is derived from the United States Geological Survey Shuttle Radar Topography Mission dataset, which is freely available at a 90 meter spatial resolution.
Plot count is calculated in the database. The plot total includes plots with data that have been (actively) submitted and saved in Collect Earth, as well as plots with data that have been entered but not successfully submitted. For example, an incomplete form where the user has not entered all of the required data will be passively saved by Collect Earth. Data from the form will be available to use within Saiku if no other data for the plot has already been actively submitted.
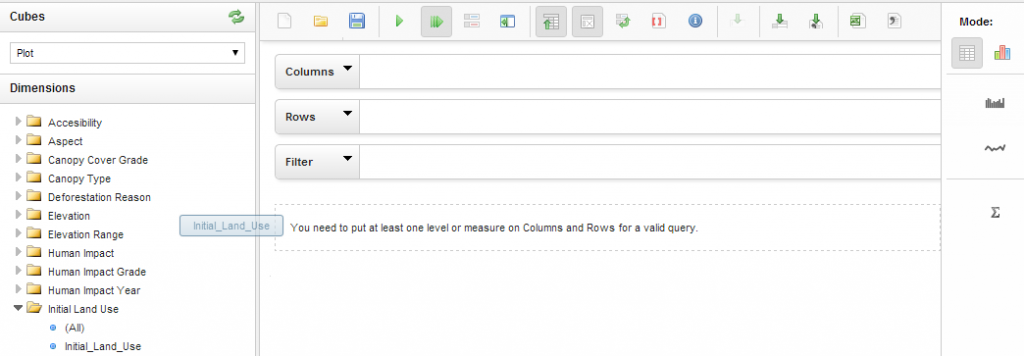
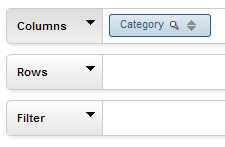
The folders listed under Dimensions contain data that the Collect Earth user has manually entered. Click a folder once to open or close it. To begin using data for a query, you can either click on the cube with the title that matches the folder name, or click on the cube and drag it to the Columns, Rows or Filter field.
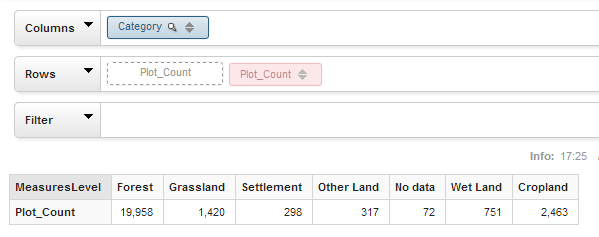
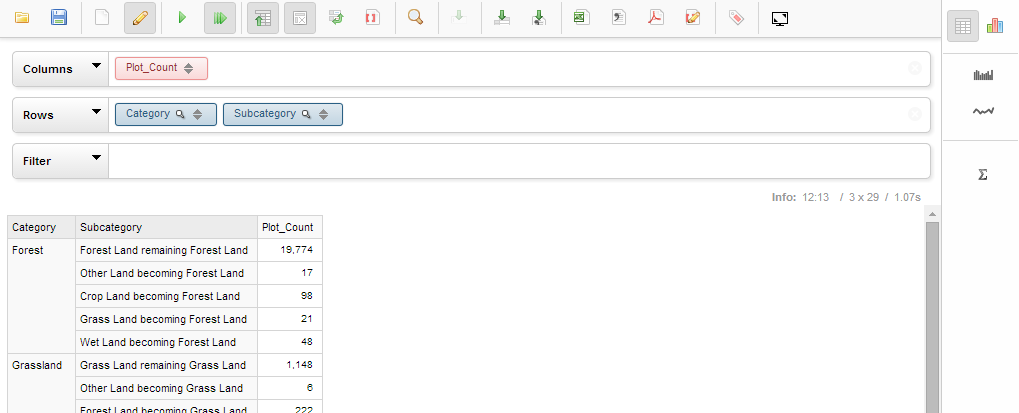
In the example below, there is a column for each land use category, and the number of plots assigned to each category in Collect Earth are listed in the first row of the table.
The side tool bar contains functions for quickly visualizing data in different formats. The default option is in tabular mode.
Within the tabular mode, it is possible to…
 | add a spark bar at the end of each row,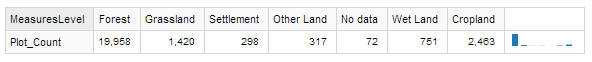 add a spark line, |
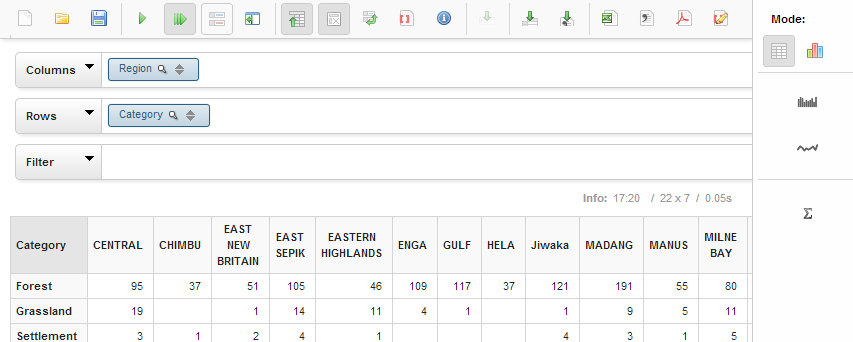
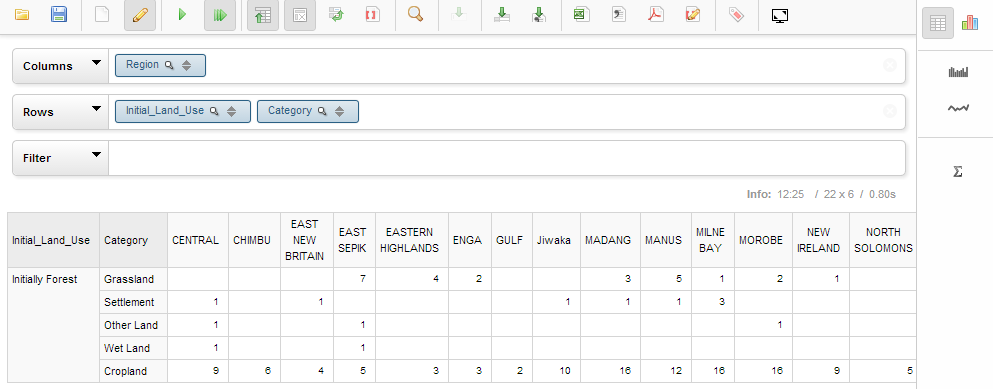
Calculating basic statistics is useful when working with two or more data series. Add Region to the Rows field, beside Plot count. Notice that a row has been added for each region and the number of plots for each land use category is listed by region.
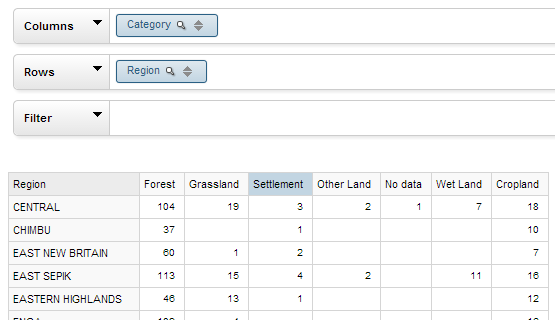
Plot count is always the default measurement. If any other cubes are placed in the Rows field, the Plot count measurement cube can be removed and the values will remain the same.
In the example on the left, each land use category has a data series representing the distribution of plots throughout the various regions.
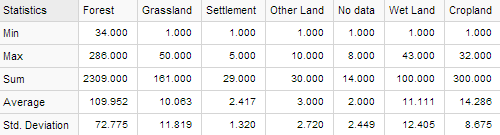
Click to view basic statistics are provided for each data series (column).

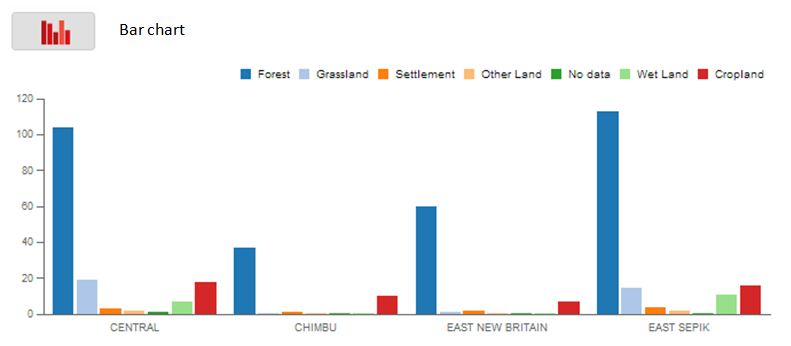
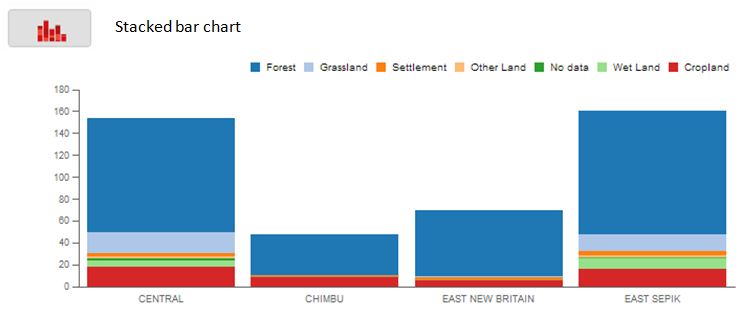
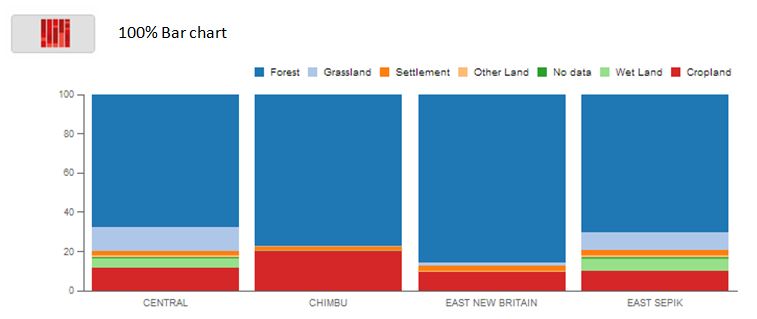
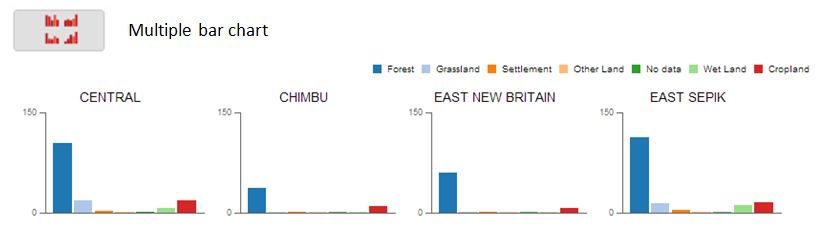
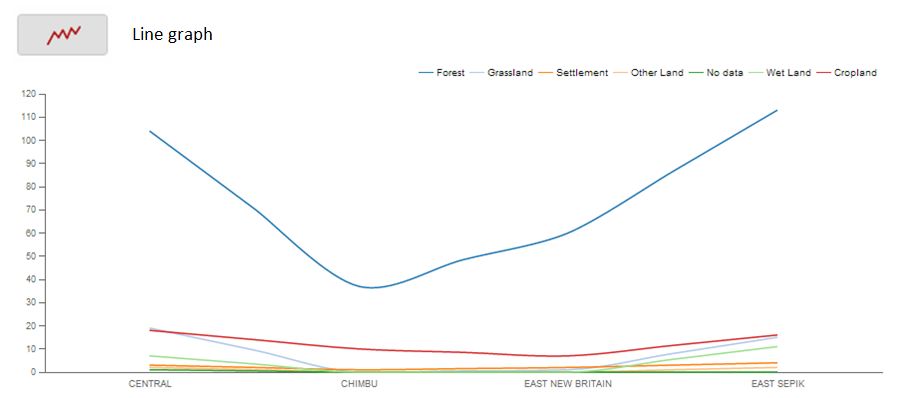
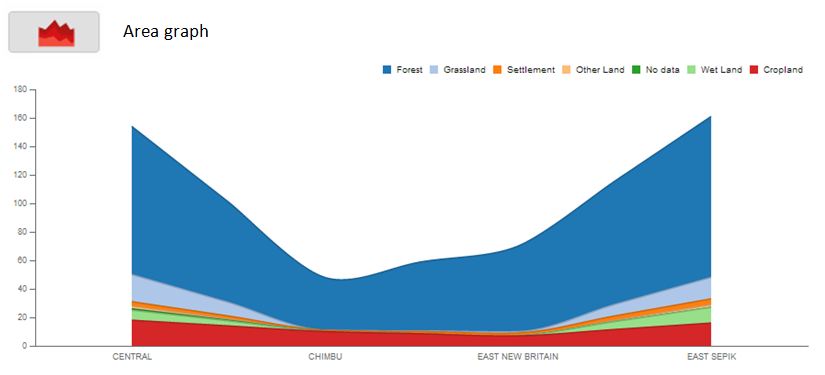
Within chart mode, it is possible to view data in a
There are numerous ways to filter data in Saiku. Data can be filtered before and during a query. Data can also be filtered after running a query, while viewing results in Sauki’s interactive tables and charts.
Filtering data in a query: option 1
Example: Number of deforested plots per land use category
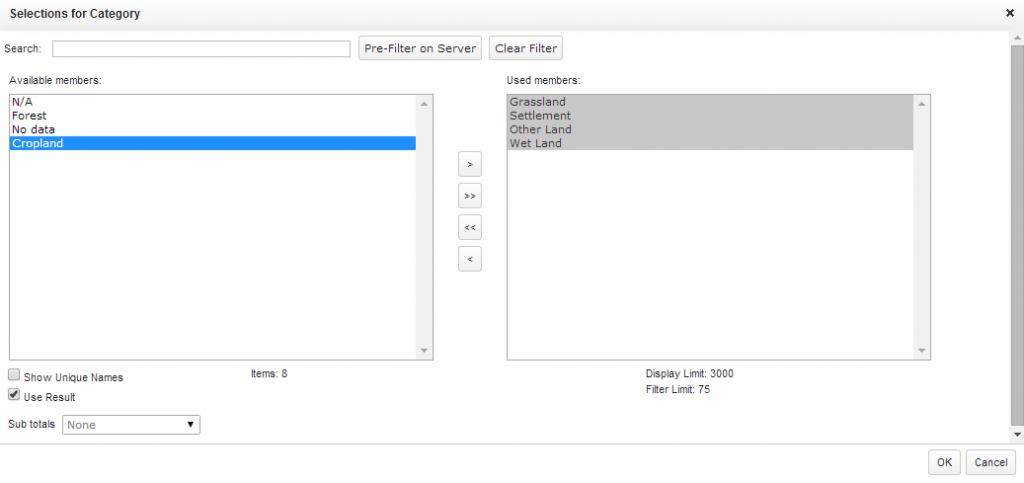
Deforested plots are those that were initially forest, but now belong to a different land use category. Start by selecting the non-forest land use categories. Move the land use category cube to the columns field.
Click on the filter icon (the magnifying class) beside the cube name to view the filter window. Select the “members,” the land use categories in this case, that you wish to use. Use the arrows to move them to the column on the right. To select multiple members, hold the Control key. Click OK to save the filter settings.
Filtering data in a query: option 2
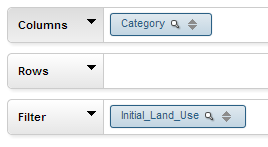
Drag the land use category cube to the Columns field and the initial land use cube to the Filter field. The filter window will immediately pop up.
Move Initially Forest to the column on the right.
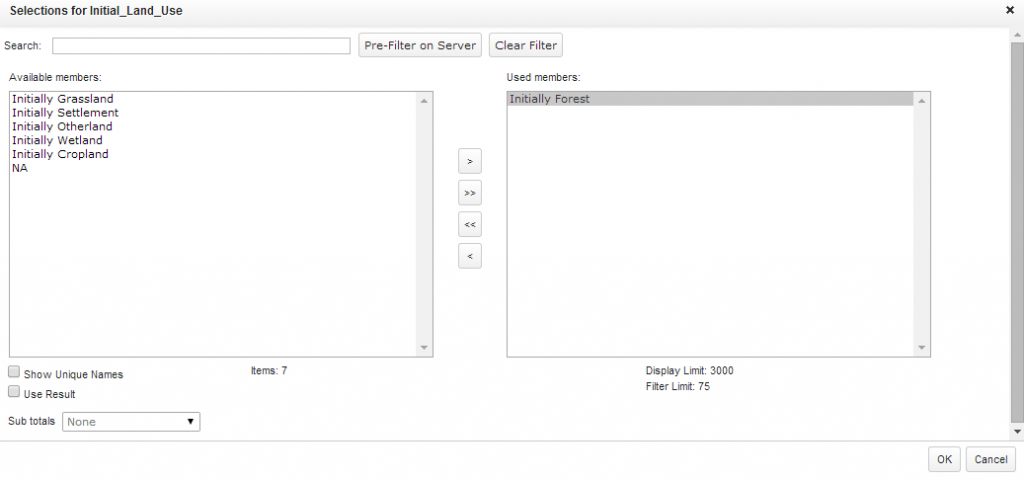
Click OK and view the results.
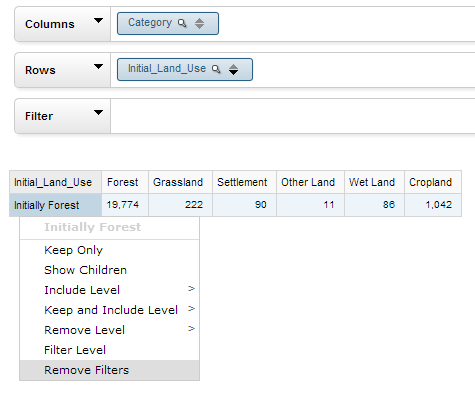
Filtering data in tabular mode
With land use category in the columns field and initial land use in the rows field, click on Initially Forest in the chart, then select Keep Only.
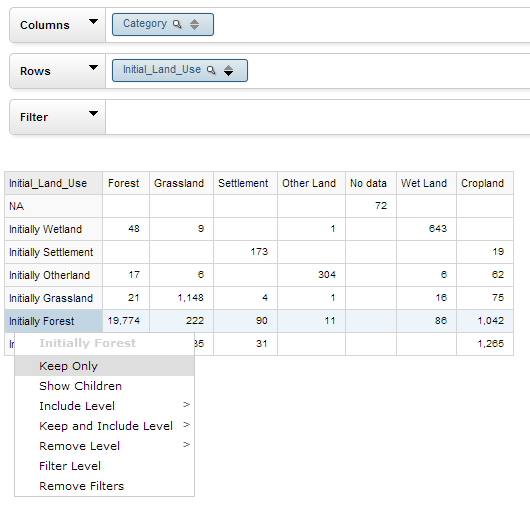
Click on Initially Forest again, and select Remove Filter to return to the original table.
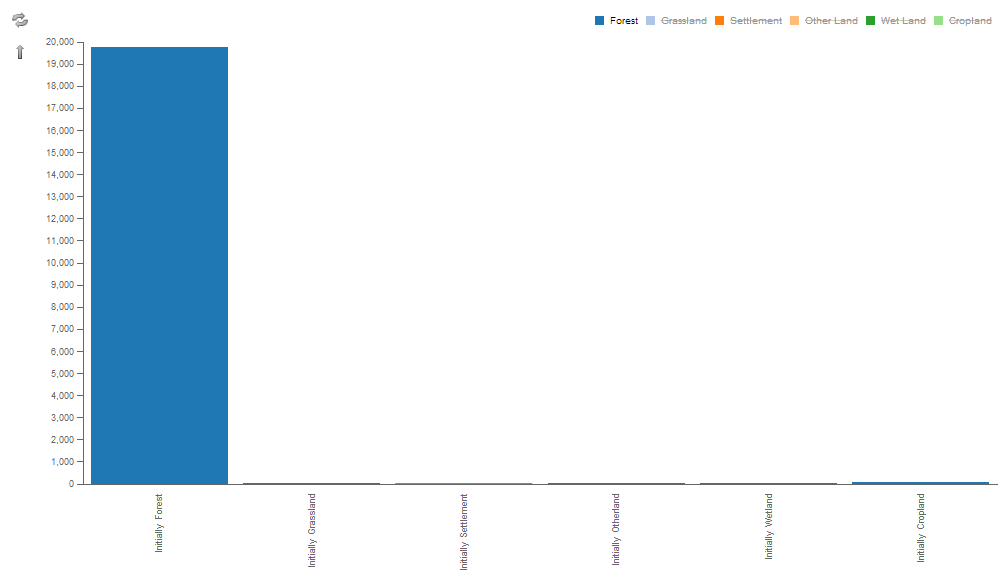
Filtering data in chat mode
With land use category in the columns field and initial land use in the rows field, view the query results as a bar chart. Every item in the table can be selected, including the colored boxed and the data series names in the legend.
- Click on the blue box for forest in the legend to display only forest data.
- Click on the circular arrows symbol in the upper-left corner to re-render the chart.
- Click on the Forest data series title to only remove forest data from the chart.
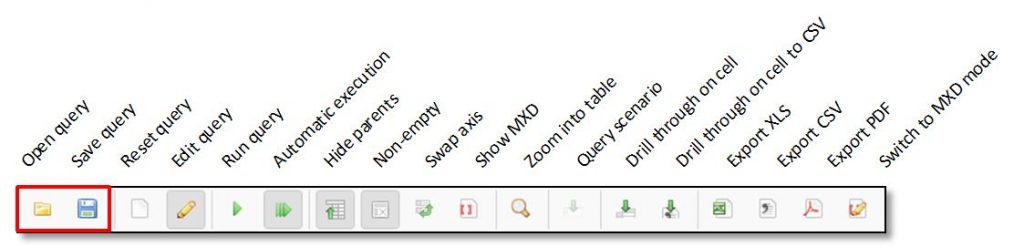
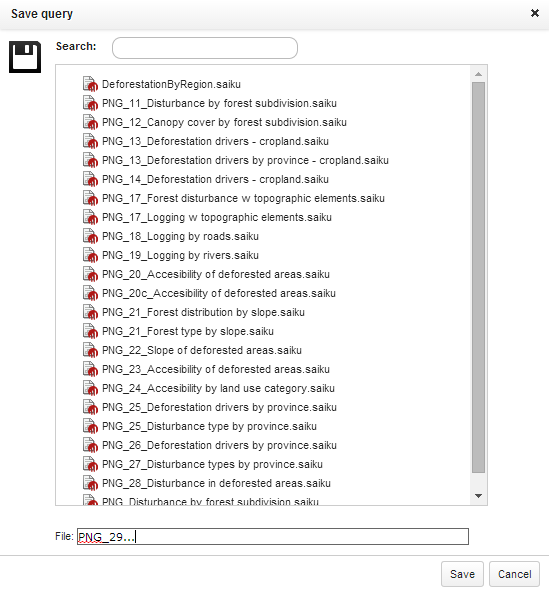
The main Saiku tool bar includes common function such as saving and opening queries. To save, type the new file name and click save. When using Saiku Server in the default mode, the saved queries will only be viewable by you. If you are connected to a common Saiku Server, saved queries will be viewable by everyone.
The window for opening queries is almost identical to the window for saving queries. Type keywords in the search field to filter the list of your queries. Then double-click on a query title to open it.
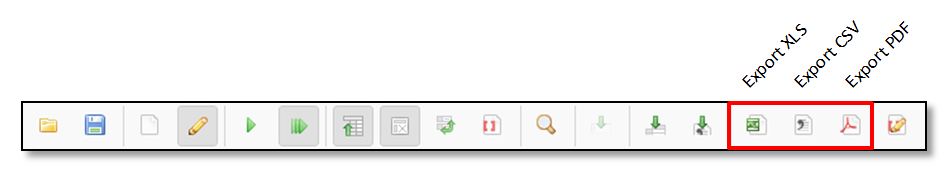
Data tables can be exported in Microsoft Excel, CSV and PDF formats.
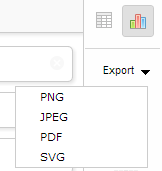
Charts can be exported in SVG, PNG, PDF and JPEG formats (listed in order of file size, from small to large).
- Plot counts by land use sub-category
- Land use category plot counts by province (table mode)
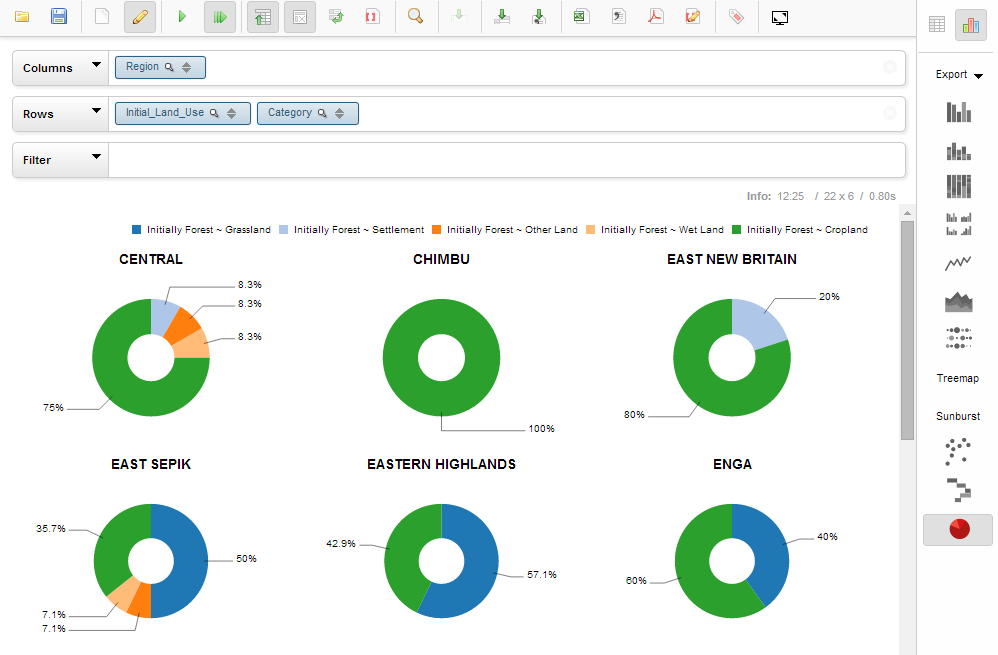
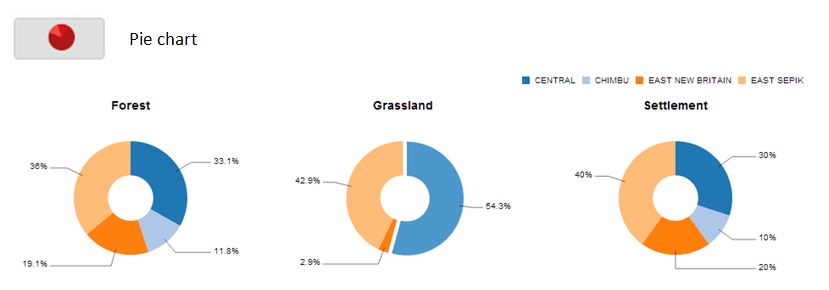
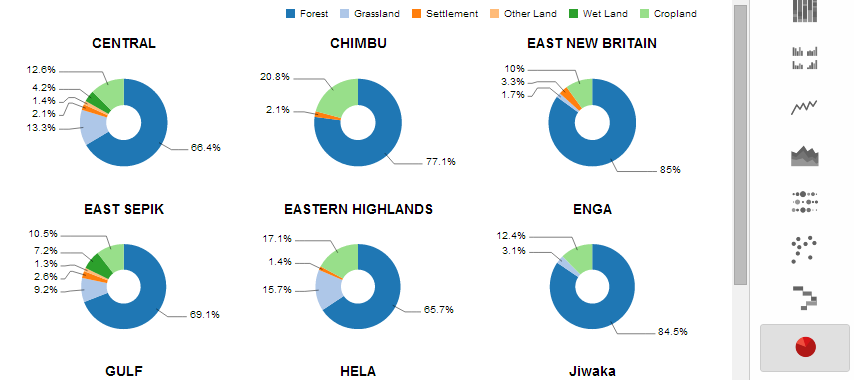
- Land use category plot counts by province (pie chart mode)
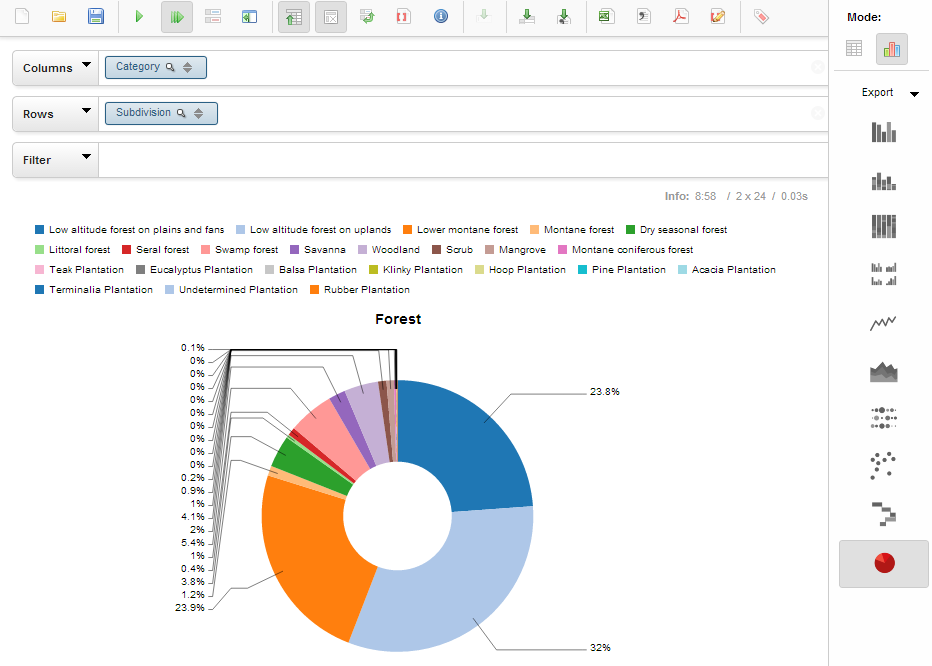
- Forest composition (pie chart)
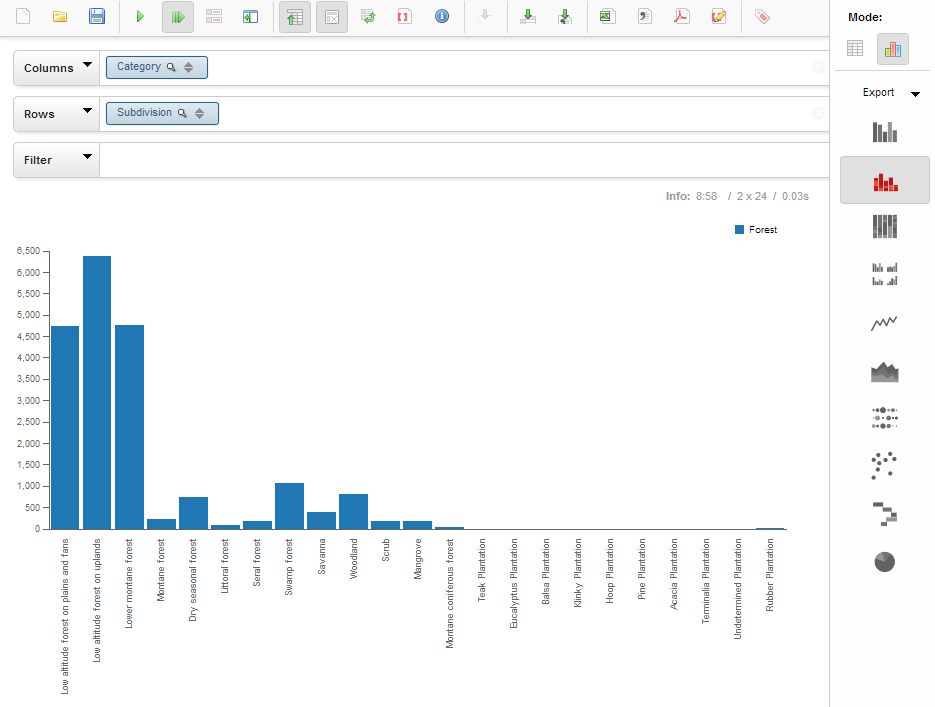
- Forest composition (bar chart)
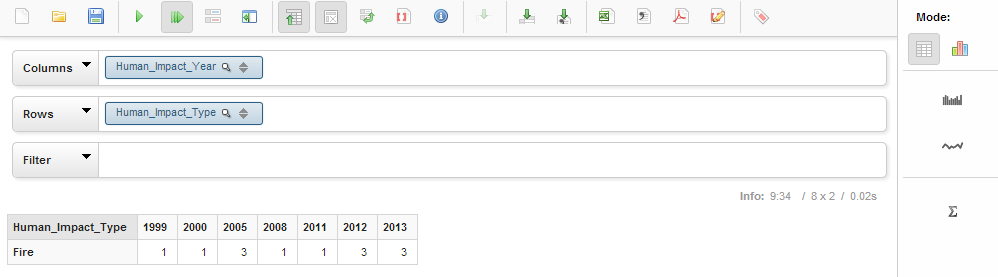
- Fire occurrence over time
- Composition of deforested land by region (table mode)
- Composition of deforested land by region (pie chart)