Synergies between Collect Earth sampling and Wall-to-Wall mapping
Collect Earth can be used to sampling land use throughout an entire country at systematically or randomly placed points. This approach can be used to support a wall-to-wall mapping approach by generating training sites (to inform a supervised image classification) and ground-truthing data (to assess the validity or accuracy of the classification). This page presents the process for doing both with Google Fusion Tables and Google Earth Engine, however numerous other tools could be used to achieve the same objectives.
Google Fusion Tables
Log into Google Drive Google Drive or go directly to the Google Fusion Table website . You will need a Google account to proceed.
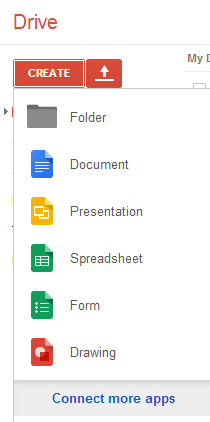
Within Google Drive, click Create in the upper-left corner. If you have never used Google’s Fusion Tables App, click on Connect More Apps at the bottom of the list.
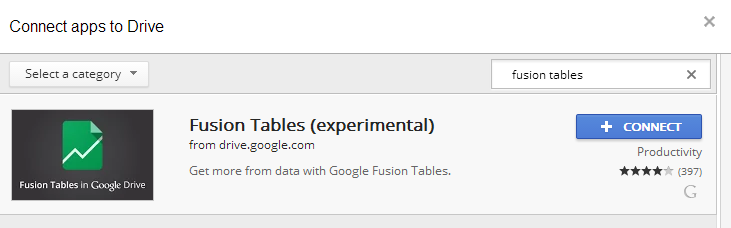
Type Fusion Tables in the search field. Click +Connect to add the app to your Google Drive.
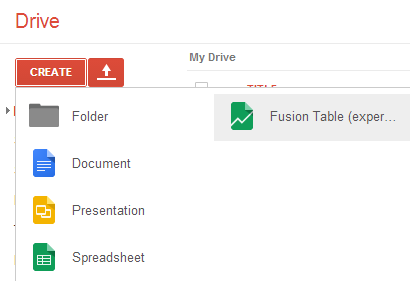
Select Fusion Table in your updated Google Drive Create menu.
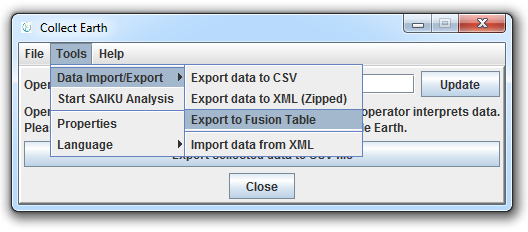
Collect Earth data can be exported as a CSV that is compatible with Google Fusion Tables. Regardless of which CED file is visible in Collect Earth, the Fusion Table option exports the entire country’s dataset.
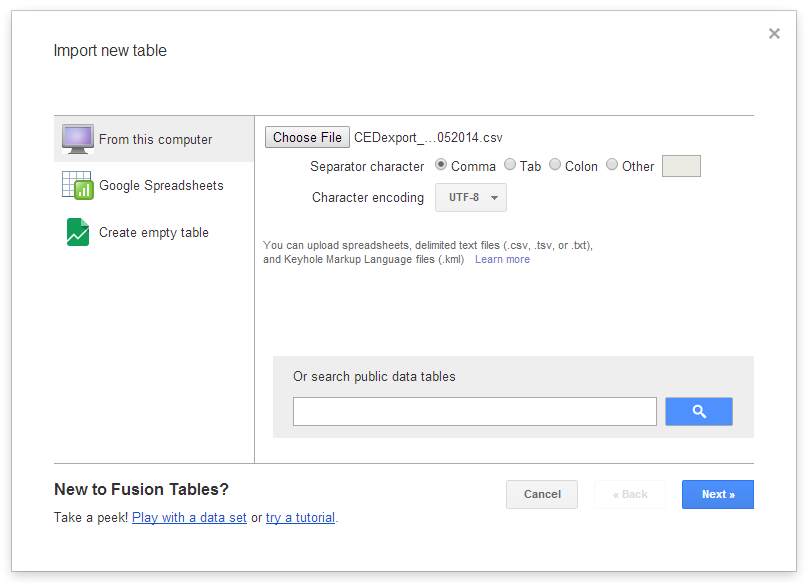
Browse for the Fusion Table file exported from Collect Earth. Click Next.
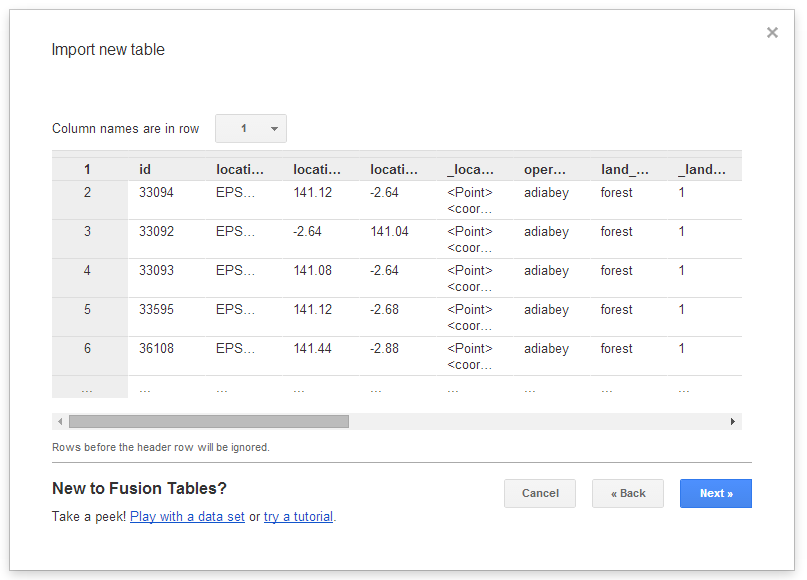
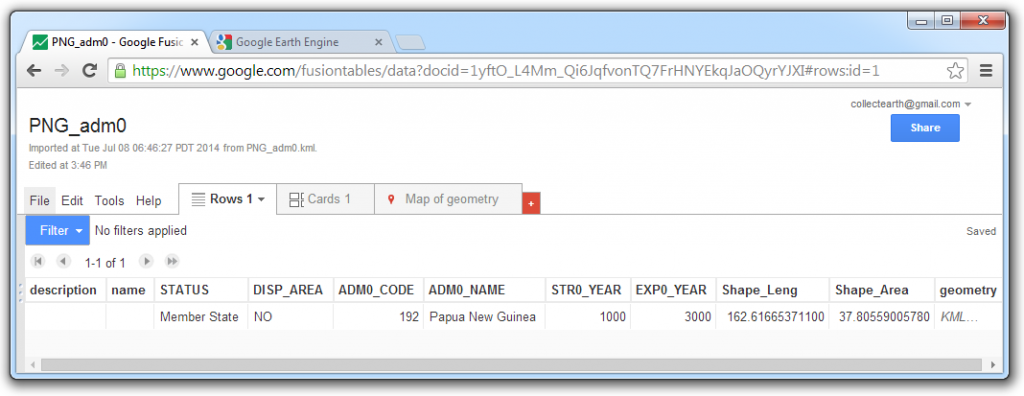
Preview the table preview. Click Next, then Finish on the following screen.
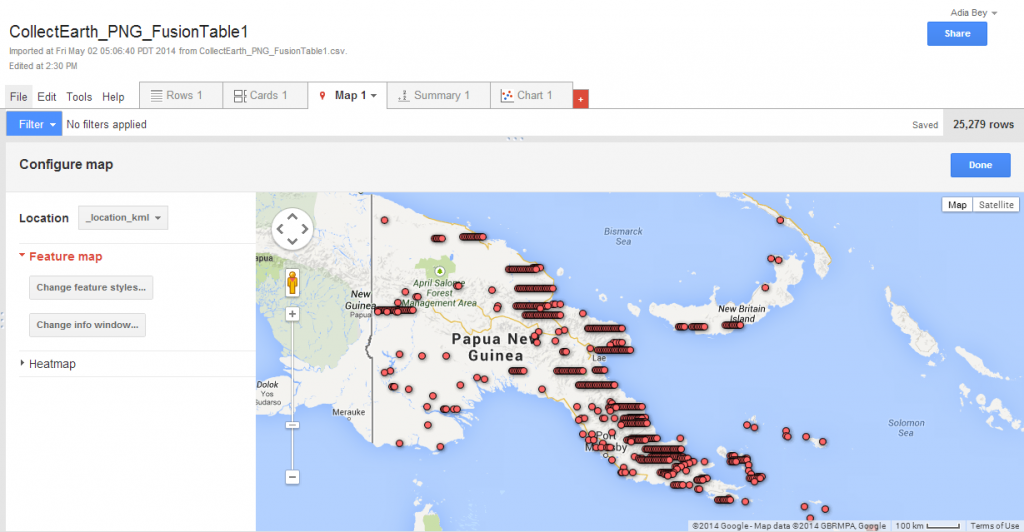
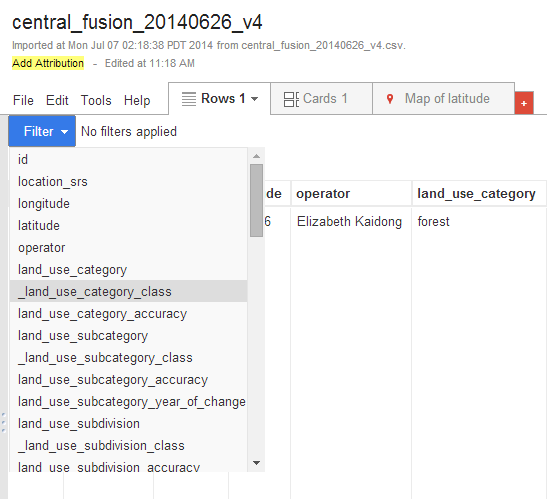
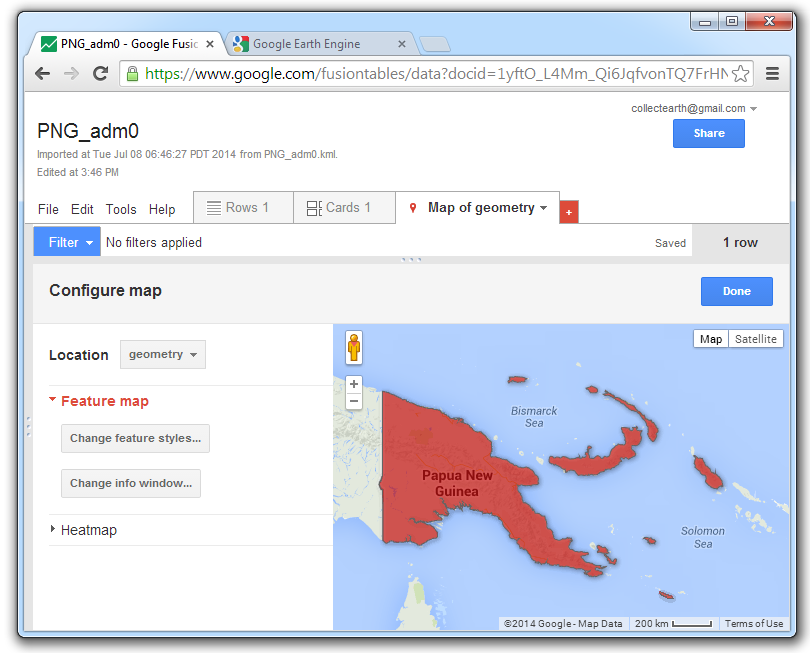
Fusion Tables can be viewed in various formats, including tabular, charts and map.
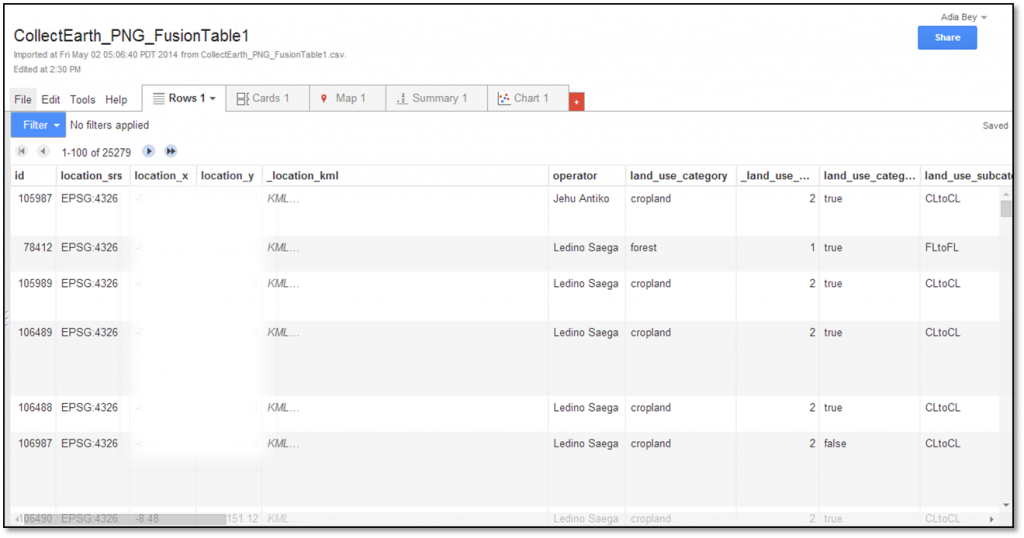
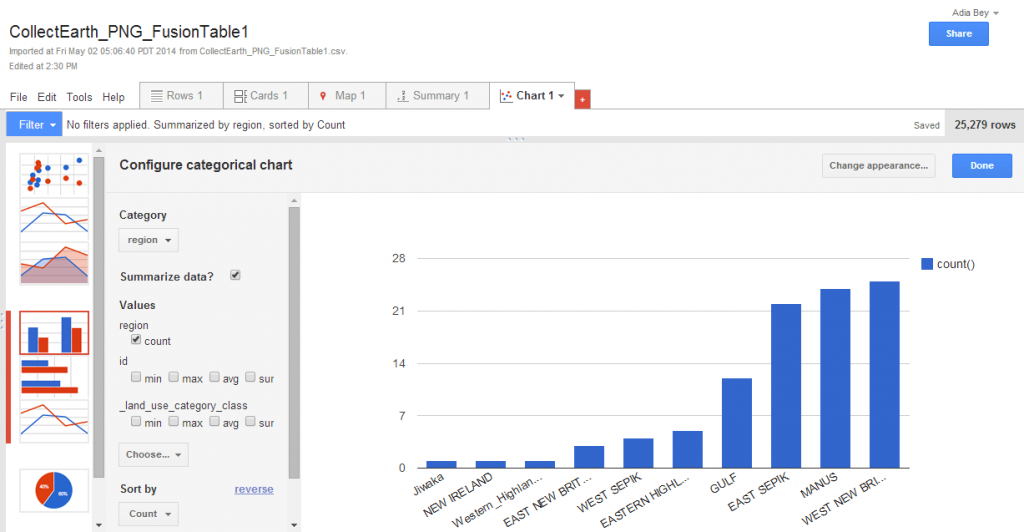
This last option is useful for quickly reviewing spatial data that will be used in Earth Engine.
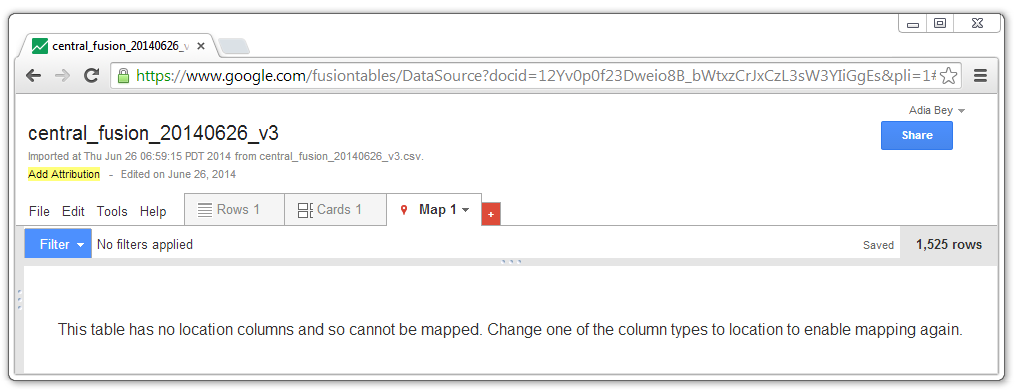
If Google Fusion Tables has difficultly geocoding the data, Earth Engine may not be able to display it. Collect Earth facilitates data compatibility by concatenating the coordinates of each point into a single column, that is identified as the location column. Vector data from other sources can also be imported into Fusion Tables (and later imported into Earth Engine). If the data does not properly geocode, the data may be poorly positioned or a message may appear regarding the lack of a location column.
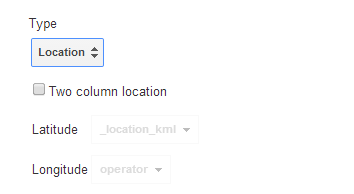
To indicate which column contains the location data, return to the Rows tab, click on the header or the column that contains location data and select Change.
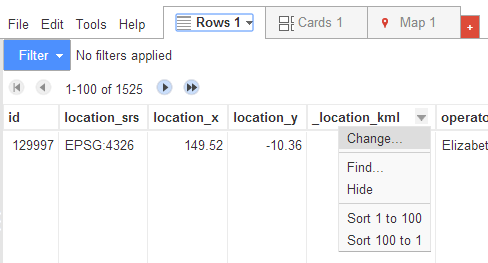
Click on the dropdown arrow under Type and select Location. Save changes.
You can filter the data and use a subset as training data for a supervised classification. For a supervised classification, it is advisable to use at least 10 points for each band of imagery and land use class. When using all 13 bands of Landsat 8 imagery to classify an area into the six IPCC recommended land use categories, it is recommended to use at minimum of 780 training points (10x13x6).
Countries that use Collect Earth as a primary means of classifying land use will have tens of thousands of points that could be used as training data for a wall-to-wall classification. Papua New Guinea and Mongolia, for example, have conducted land use assessments using a systematic grid comprised of 25,000-30,000 points. However, using the entire dataset in a classification will not necessarily improve the results.
It is best to use a subset of the data that surpasses the minimum amount recommended and (ideally) includes the portion that has been quality controlled.
The data can be filtered by…
- Land use category to filter out points that are not assigned to one of the six land use categories
- Land use category accuracy to filter out the false values (where the operator was uncertain of the land use category)
- Actively saved to filter out the false (provisional) values
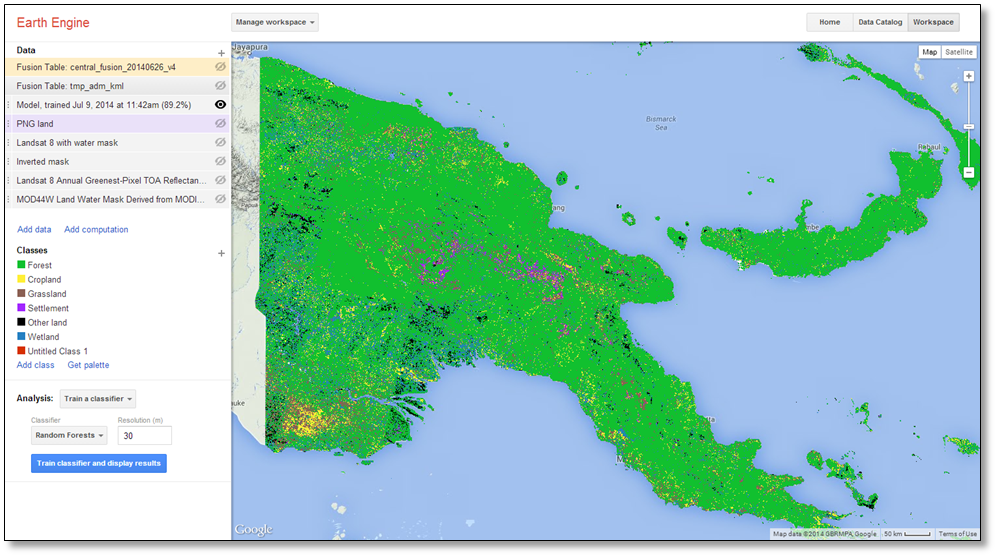
This example uses data from one province. If national data is available, a broadly, evenly distributed set of training sites should be used to train a classifier. In the following example, data from Central Province in Papua New Guinea is used as in input for the Random Forest classifier.
To access the table in Earth Engine, the table must be publically available. Click on Share in the upper right corner.
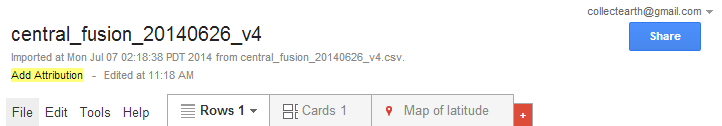
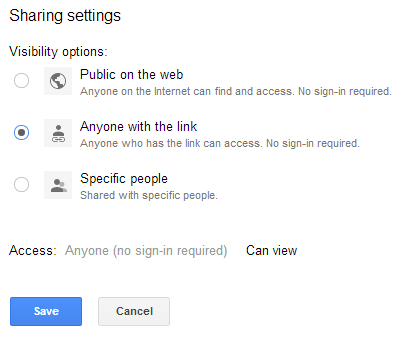
Under Who has access, click on Change.
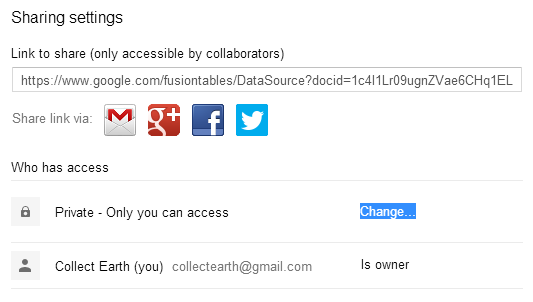
Select Anyone with the link or Public on the web as the new visibility option.
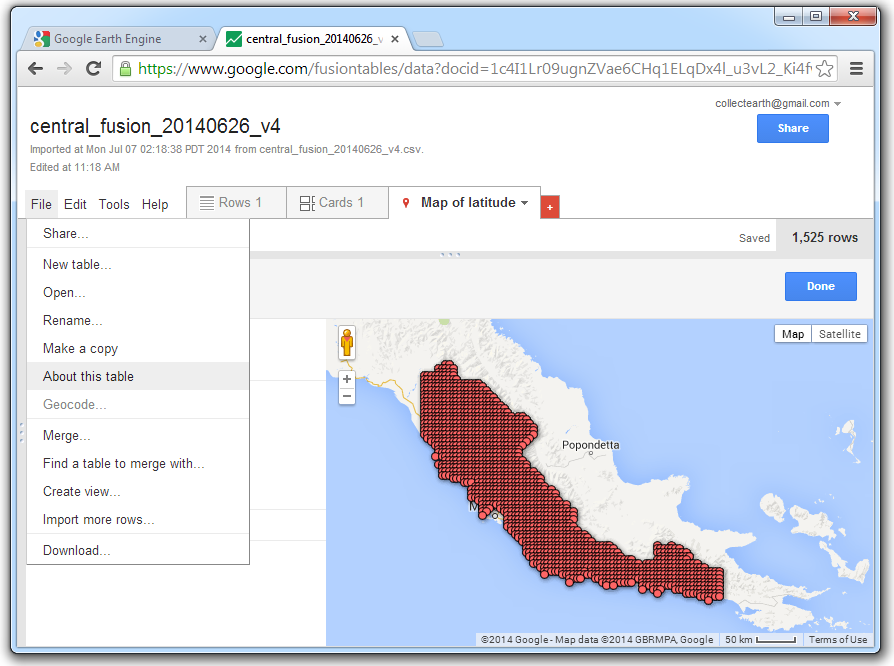
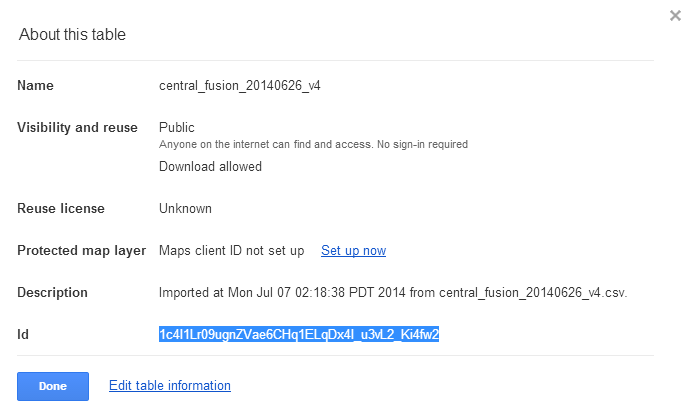
Once the file is classified as public, you will need the table ID to import it into Earth Engine. Click on File and select About this table.
Copy the table ID.
KMLs from Google Earth or QGIS can also be imported into Google Fusion Tables and later used in Earth Engine. The process is the same as the one for CSVs.(Shapefiles can be converted to KMLs in QGIS.)
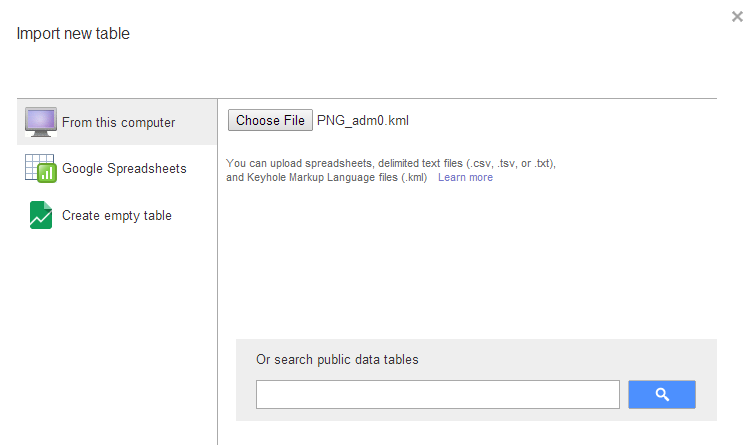
Vector data that may facilitate land use classification or help delineate the area of interest can be imported into Google Earth Engine as a Fusion Table.
Google Earth Engine
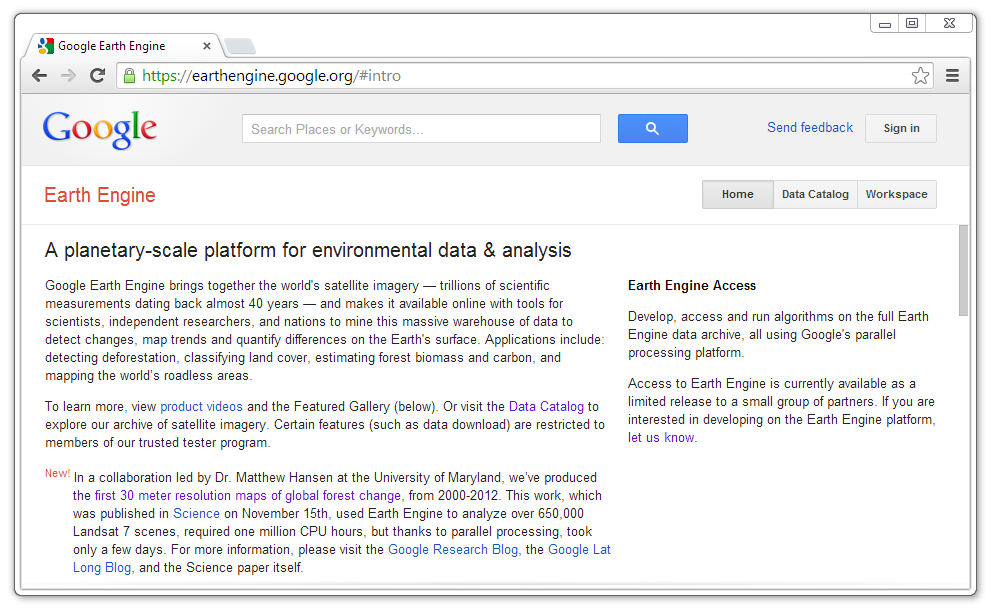
Google Earth Engine is a web-based platform for processing satellite imagery and other spatial data. Earth Engine facilitates access to over 40 years of continuous, earth observation data gathered by the United States Geological Survey (USGS) Landsat Program. Earth Engine was developed by Google, in partnership with Carnegie Mellon University, NASA, USGS and TIME.
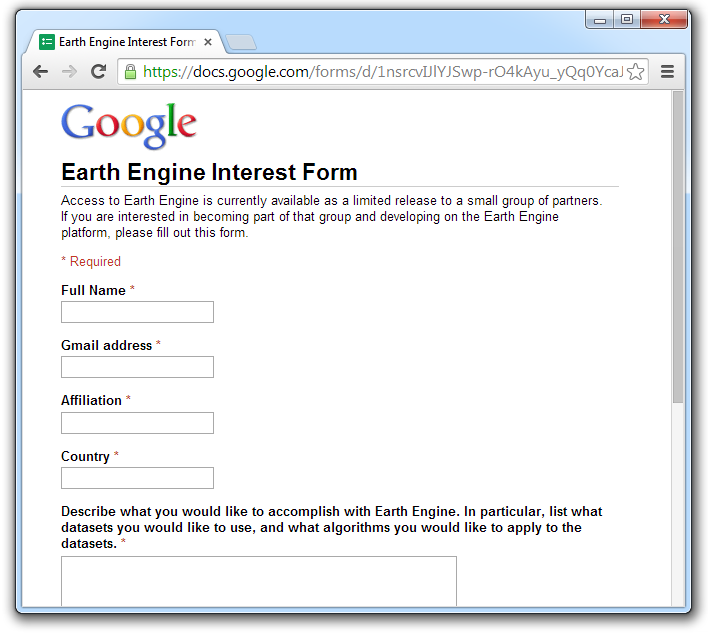
A public version of the tool is available here . However, trusted users privileges are required for the processes described in the following section. Under Earth Engine Access, click on Let us know.
Complete and submit the necessary form to be granted tester privileges. The approval can take days or weeks. Once you receive your login details via email, return to the Earth Engine homepage and login. Note: It is possible to sign in with your Google account. However, the trusted user privileges will not be available unless you have completed the form and been granted trusted tester privileges.
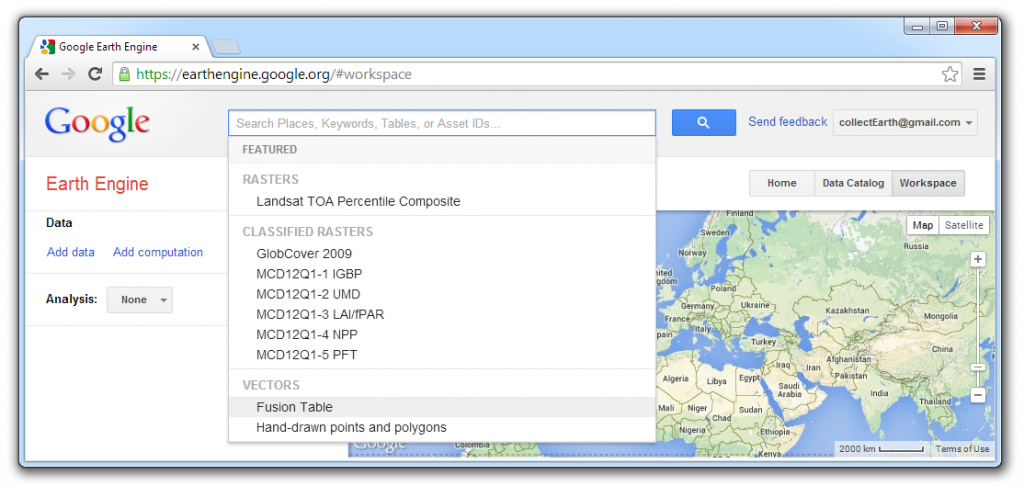
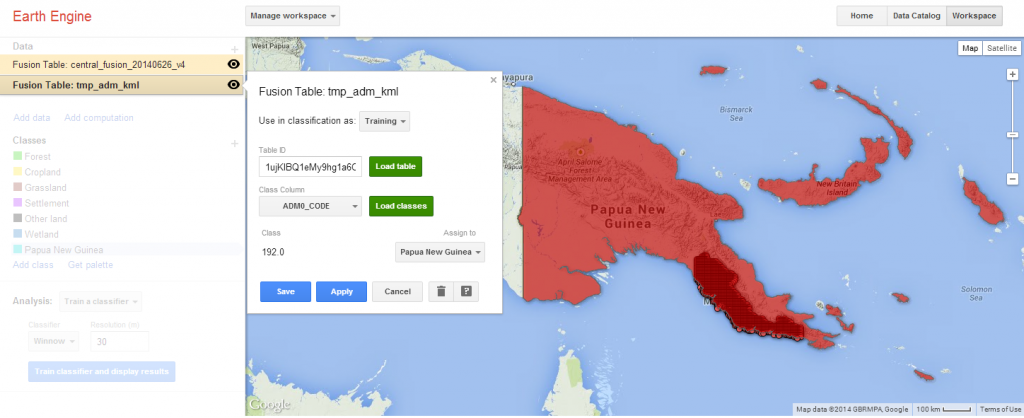
There are three main sections of Earth Engine: the home page, the data catalogue and the workspace. In the workspace, add Collect Earth data by importing the Fusion Table. Click on the main search field and select Fusion Table.
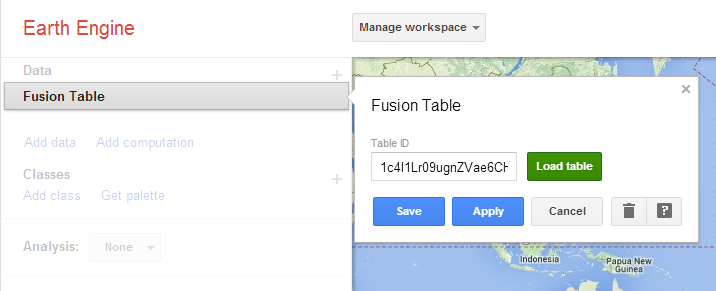
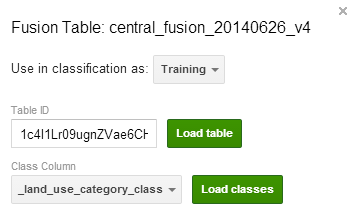
Paste the ID of the Fusion Table and Load the table. (Delete any extra tabs or spaces.)
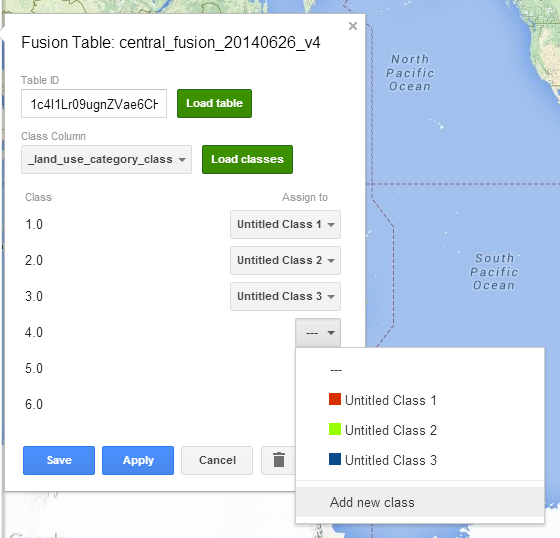
Select Land use category as the Class Column and click Load the classes. Assign each class to a separate clas and Save these settings.
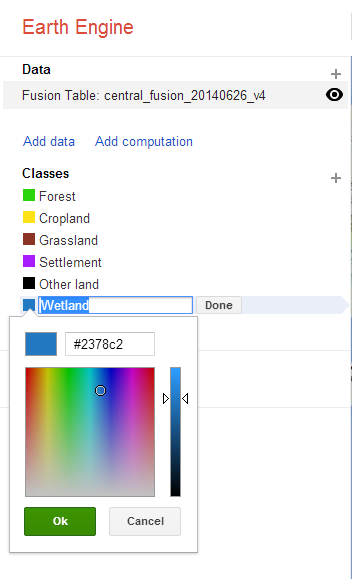
Once the table has been loaded and the classes assigned, modify the title and color of each class to reflect the land use categories in the fusion table. Click on the name or color of the class to change each.
Boundaries of an area of interest can also be added to help define the geographic scope of a classification. This may be useful with archipelagos or sub-national classifications.
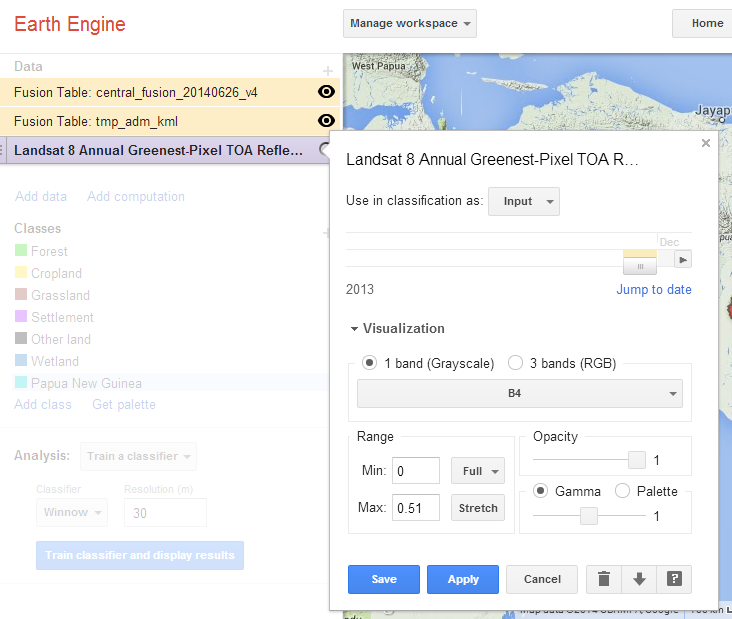
Landsat’s Greenest-Pixel Top of Atmosphere (TOA) Reflectance series is well suited for classification because it pools imagery acquired over the course of 8 days, 32 days or 1 year to create a composite of pixels with the highest NDVI values. The resulting image tends to have less cloud cover and atmospheric noise than images acquired on a single date. In areas with persistent cloud cover and low seasonal changes in phenology (e.g. the tropics), the Annual Greenest-Pixel TOA imagery is recommended. Where seasonality is high and cloud cover is generally low (temperate areas), the 32-day composites will provide better results.
For Papua New Guinea, use the most recent annual greenest-pixel image.
- Click on the search field and type the exact title of the layer or enter a keyword such as “greenest”. Select the appropriate layer from the updated list of search results.
- Indicate that the classification will be used as an input.
- Jump to date 31 December 2013 to draw upon a complete calendar year’s worth of greenest pixel data.
- Save these settings.
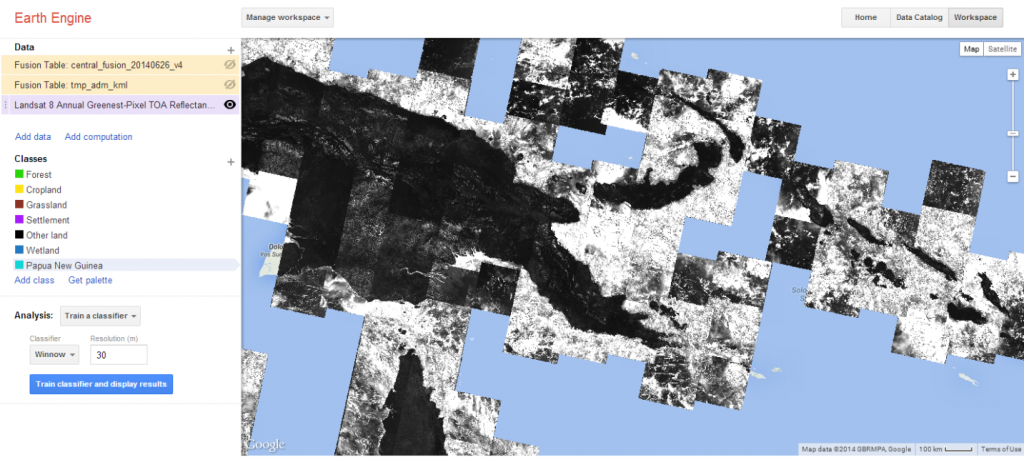
Make the previous layers invisible by clicking on the eye icon beside the title of each layer.
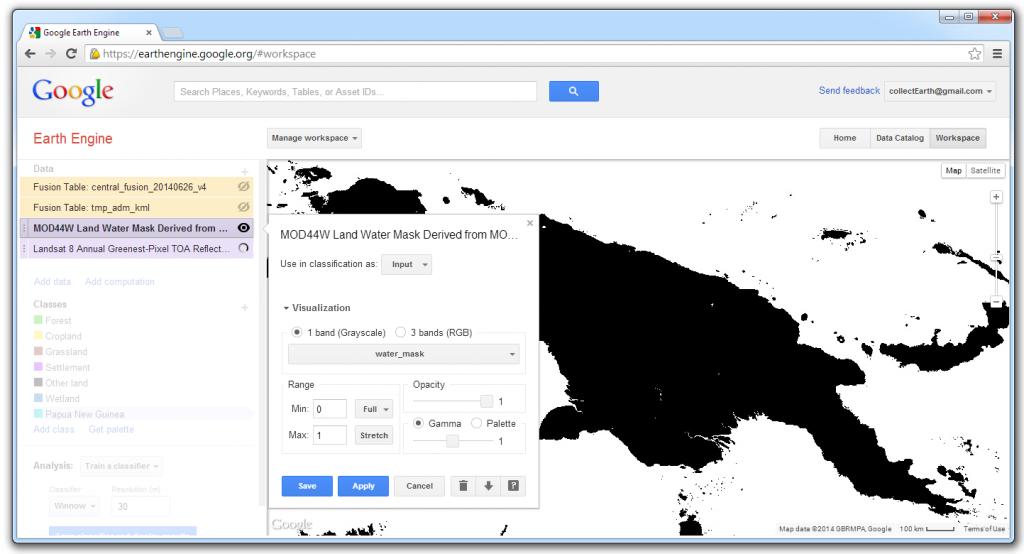
Add the raster MOD44W Land Water Mask Derived from MODIS and SRTM L3 Global 250m SIN Grid.

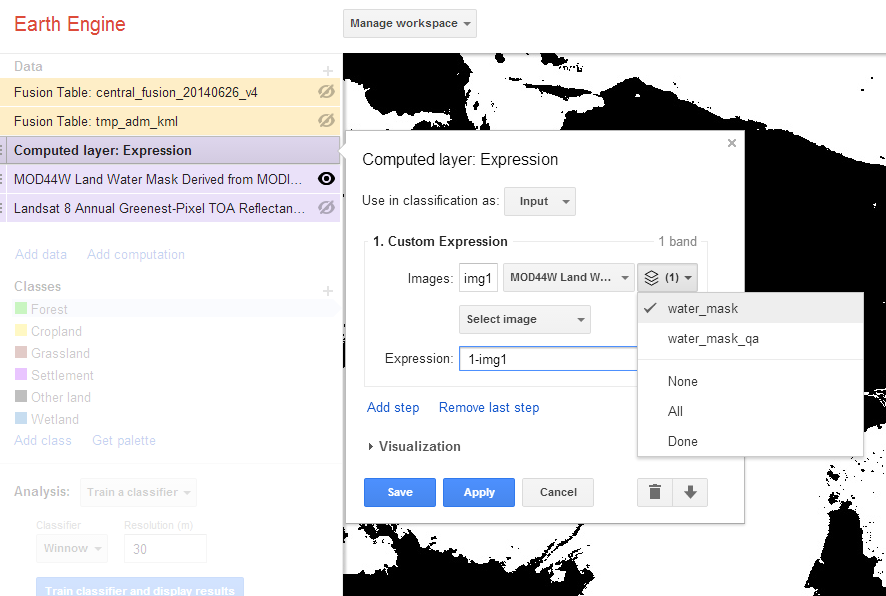
The MODIS Land Water Mask contains only 2 values. Land (value = 1) is visible and water is not (value=0). The raster must be inverted so that the water class is visible, and thus ready to mask or exclude water from further analysis. The land class should have the null value, enabling the values from the underlying layer to be used. Click on Add computation and select Expression.
Use the MODIS Land Water Mask as the input image. Click on the dropdown box for the bands. By default, both bands have tics marks. Click on water_mask_qa to remove the check beside it. (Only the band water_mask will be used.) In the Expression field, type: 1-img1. Click Save to run the computation. With the default visibility setting, the result appears completely white.
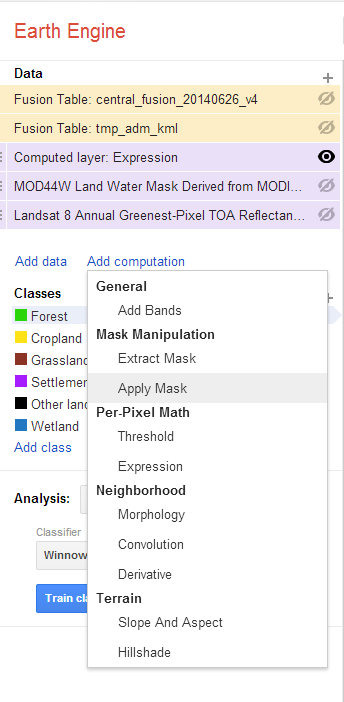
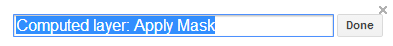
Return to the computation menu and select Apply mask.
Select the Landsat Greenest-Pixel layer as the primary input image. Indicate that the mask is a raster and select the Computed layer as the secondary input.
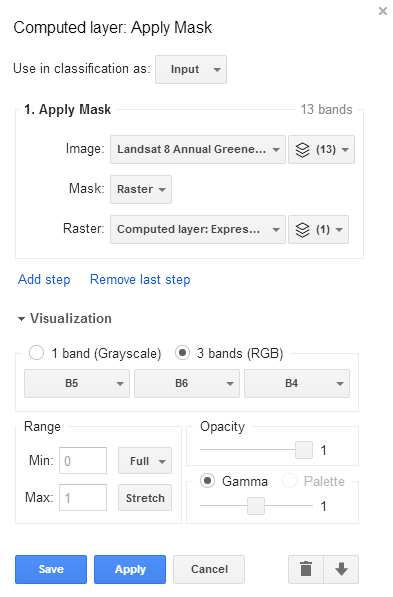
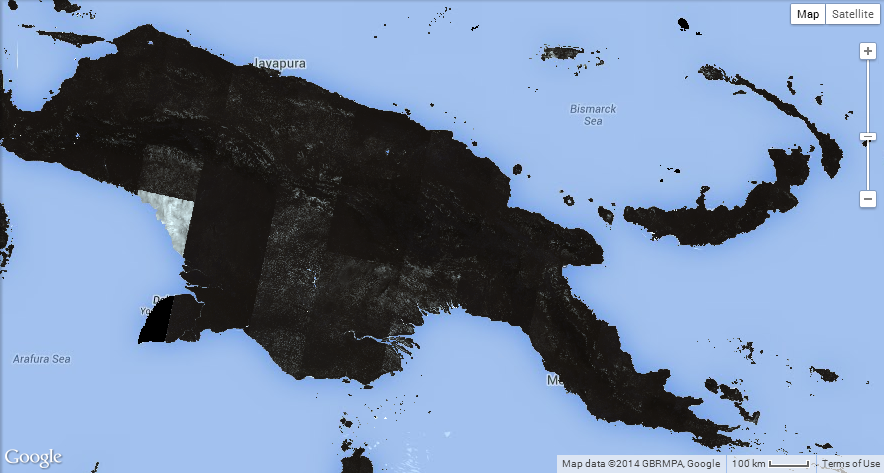
The resulting layer is a Landsat 8 image of 13 bands covering land only.
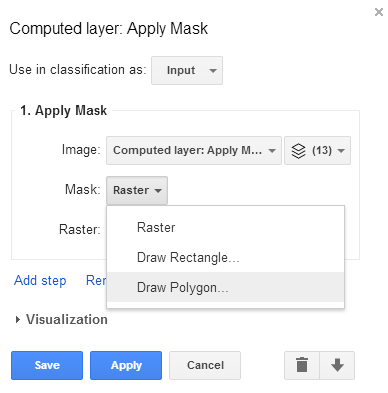
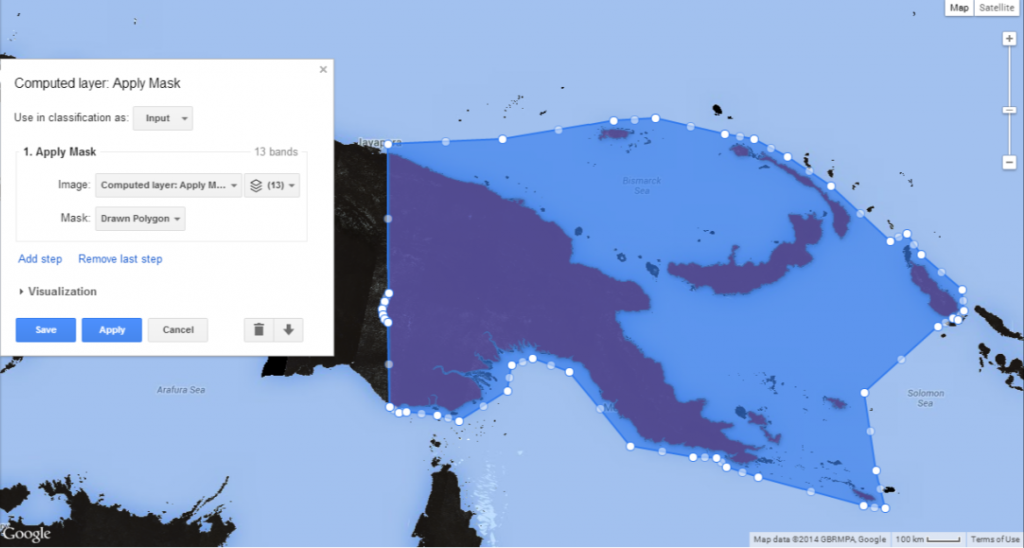
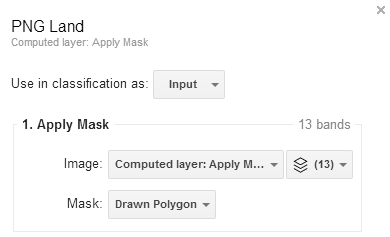
Apply a second mask to hone in on the area of interest. Return to the Add computation menu and select Apply mask again. The primary input will be the recently computed Landsat 8 image covering land only. Click on the dropdown box beside Mask and select Draw polygon.
If the boundaries of the area of interest are not entirely clear, use supplementary data to guide the process of outlining the area of interest.
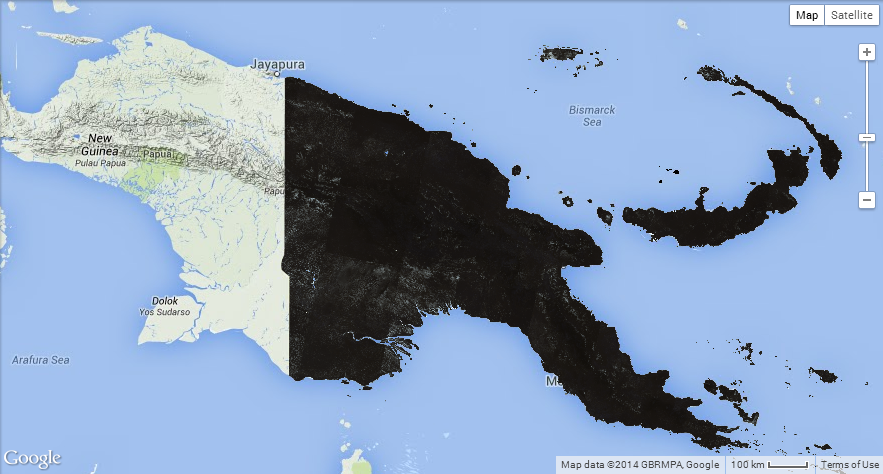
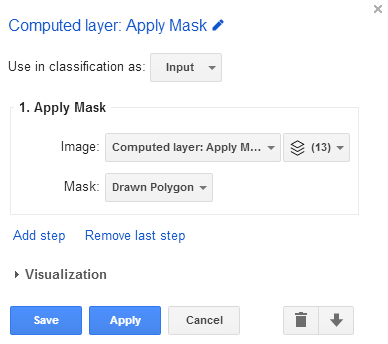
The resulting layer is a Landsat 8 image of 13 bands covering land in the area of interest. Running a classification on a smaller area will reduce the processing time and it may improve the classification accuracy.
There are now two layers with the same name. In the settings window of each layer, click on the layer title to begin editing it.
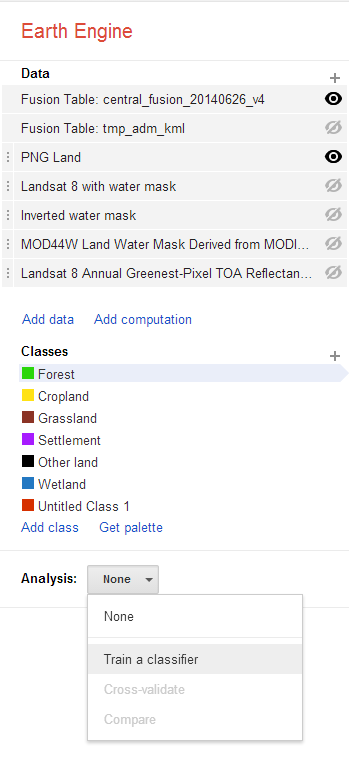
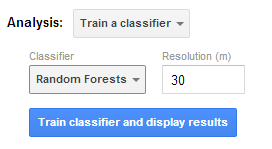
In the Analysis section, select Train a classifier. Click on the dropdown box under Classifier and select Random Forest. Leave the resolution at 30m.
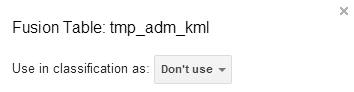
Before running the classification, review all of the layers’ settings and indicate that only the Collect Earth Fusion Table and the area of interest land will be used as inputs in the classification.
All of the other layers should be set as Don’t use.
In the Analysis section, click Train classifier and display results.
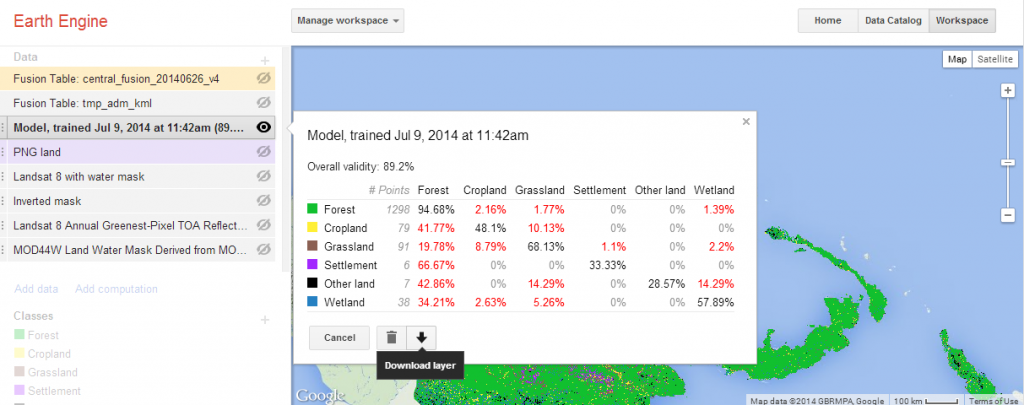
Depending on the size of the image you are classifying, this process may take several minutes. To view the status, click on the layer.
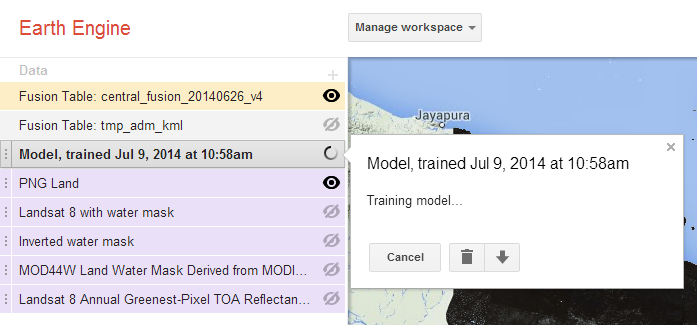
Once the classification is complete, the settings window of the layer will display an error matrix of the results. Earth Engine draws upon a portion of the training data to assess the validity of the classification and to quantify errors of commission and omission.
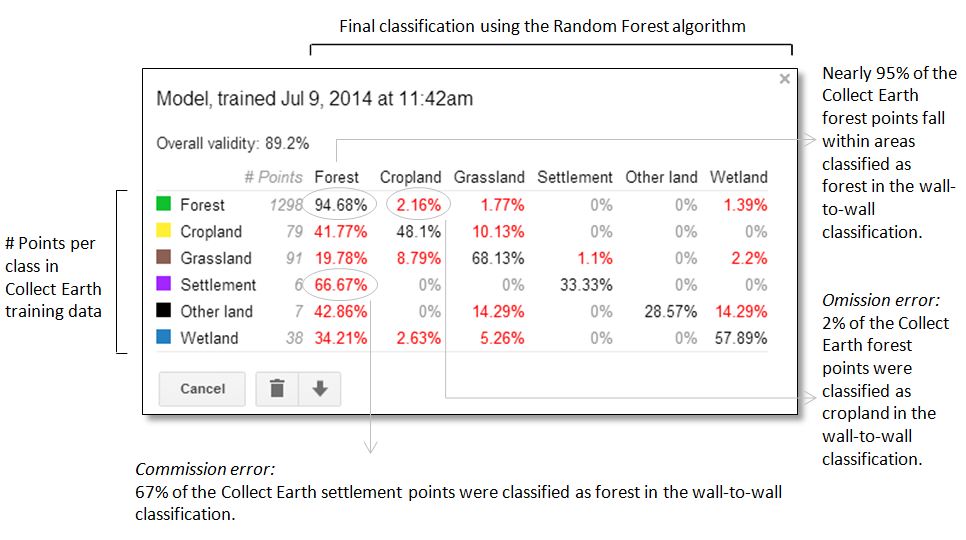
The results can inform further work in Collect Earth that may improve the accuracy of future classifications. When reviewing classification results, consider the following key points:
Land use and Land cover
Land cover is “the observed physical and biological cover of the earth’s land, as vegetation or man-made features.” In contrast, land use is “the total of arrangements, activities, and inputs that people undertake in a certain land cover type” (FAO, 1997a; FAO/UNEP, 1999).
In Papua New Guinea, many settlements have been established in forest areas, which largely retain their forest cover, but are interspersed with gaps in the canopy where dwellings constructed of forest materials are visible. These forest settlements tend to be flanked by “gardens,” small-scale agricultural areas where edible subsistence crops are grown. Many of these small-scale croplands retain some forest cover. The Collect Earth sampling approach, which largely relies upon manual visual interpretation of high spatial resolution imagery is well suited for detecting these types of settlements and croplands, which retain some tree cover. In contrast, Earth Engine’s automated interpretation of medium resolution imagery is prone to classify these areas with large amounts of tree cover as forest; hence the substantial commission error with forest.
Classification objective
The validity of the classification is nearly 90%. While this figure is important, the validity of a particular class may be of greater importance depending upon how the wall-to-wall classification will be used. If this classification were intended to determine the spatial extent of forest and potential forest inventory sites, this classification with 95% validity in the forest class might be suitable. However, a map with less than 50% classification validity for the cropland, settlement and other land and would be inadequate for national reporting of land use, land use change and forestry to the UNFCCC. This is particularly problematic because such high levels of commission error with forest land is likely to inflate carbon stock values.
Stratified sampling and adequate sampling sizes
Drawing upon over one thousand training points, the Random Forest algorithm performs extremely well when classifying forest areas. The remaining classes have 93% – 99.6% fewer training points, and consequently, poorly defined class boundaries Increasing the number of training points for these under represented classes through a stratified-random sampling scheme may improve the overall validity of the classification.
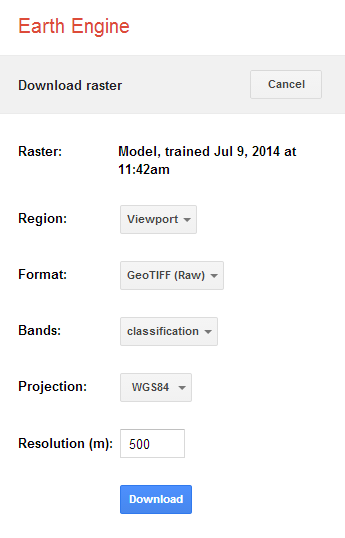
Layers that have been computed in Earth Engine can be downloaded and used in other GIS applications such as QGIS. Click on the download icon at the bottom of the layer settings window.
Enter your preferred format, projection and resolution before clicking Download.
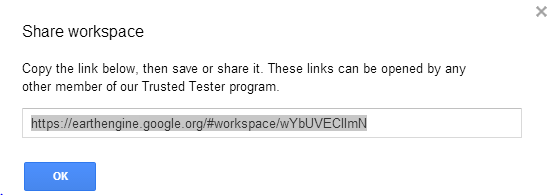
A workspace with its assorted raster and vector files and Earth Engine computed layers can be saved by clicking on the Manage workspace button up top and selecting Save now.
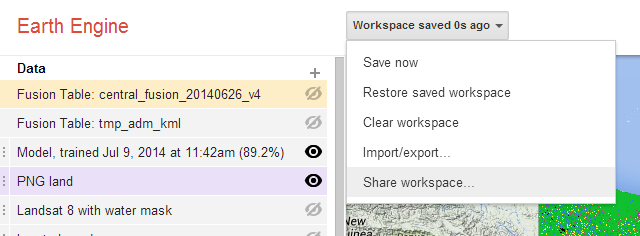
The Share workspace option generates a link that can be used to revisit a saved workspace or to share it with others.